The design of this project was to wiring up two Siemens S7 PLC’s in series so that a realistic process could be simulated & controlled. Our design was based upon an industrial Heating/Air Conditioning system designed to heat/cool a room to maintain a desired ambient temperature.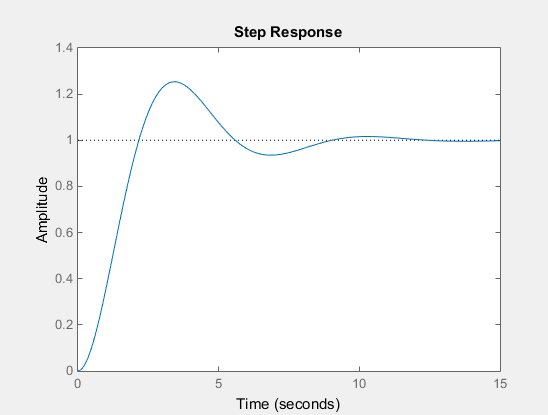
This plot is of the response of the system uncontrolled given a unit step. As can be seen the response of the system exhibits overshoot which is a common characteristic when heating something. This occurs due to a change in temperature(Set point) which drives the heater(process) to heat as fast as possible before then decreasing its output temperature to enable the response of the system to reach its desired temperature in the quickest manner possible. This heating process can be described quite well by a second order transfer function with its characteristic values as follows:
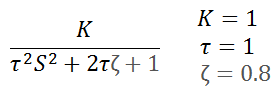
Realistically extensive testing, simulation and analysis would first have to be undertaken to find an exact model of the system, although for the purpose of this particular application a second even first order system would be more then satisfactory.
The control system itself is comprised of two Siemens S7-314 CPU units. One PLC (‘Slave’) is used for simulating the heating process, while the other PLC (‘Master’) is used at the controller which is in charge of controlling the process. This interaction between the Master/Slave PLC’s is hoped to be achieved by wiring the output of the ‘Slave’ to the input of the ‘Master’ with the output of that back to the “Slave’.
Implementation of a this heating system can be structured into 2 main phases; the process, and the controller. The controller is implemented on the ‘Master’ PLC which will act as the ‘brain’ of the simulation as it is in charge of if and when the process will reach its desired set point. The process is implemented on the ‘Slave’ PLC which will continuously function discreetly at 10ms intervals. The wiring is the most crucial element to the whole implementation of this system. Both PLC’s must communicate between one another in order for any control or response to occur.
TP177 HMI
HMI or Human Machine Interface is a visual interface commonly used within the process control industry which enables the user to visually manipulate/monitor certain aspects of the system in which is is linked to. There are various models and sized displays designed for controllers although within this project the Siemens TP177 is used to display the response of the system in real time [4]. The TP177 is a 5.7″ touch screen display with 256KB of usable memory, allowing touch based interaction within its windows based environment.
Connectivity
Although Siemens offer a wide range of connections such as USB, Ethernet, PCMCIA and SCADA, it was decided to use Siemens MPI (Muli-Point Interface) cabling which is a simplified version of SCADA [2]. The design and implementation process was greatly sped up with the use of MPI as it was capable of having the PC linked to the HMI and PLC’s at the same time with a daisy chain like arrangement [3]. Although MPI was used, it has some flaws such as having half duplex signals not allowing signals simultaneously being sent and received. This arrangement also requires terminators consisting of resistors and capacitors to prevent signals from returning back down the line.
Shift Registers
Although not required for a second order system, a 5 value Function Block was thought optimal as it allows for more debugging, code reuse and maintains each set of values for each instance in its own database.
Process Difference Equation
To calculate each new process value, the discretised transfer function was implemented in cyclically evaluated Function Call where the difference equation coefficients would be stored as constants and the new output value evaluated directly from the current shift register values. This equation was derived from the original Transfer Function mentioned above. Using Matlab, a very powerful mathematical tool we where able to simply run the continuous to discrete function (C2D). Before then using simple mathematical algebra to rearrange to give us our difference equation.
Disturbance Function
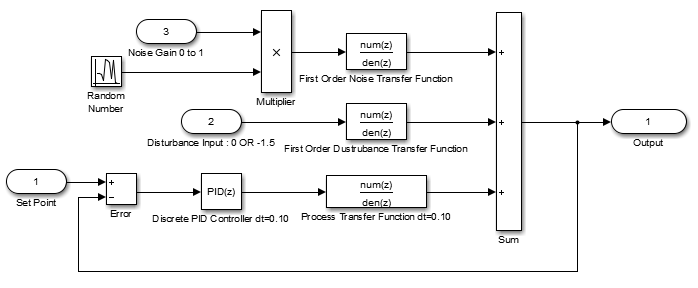
In a real situation of a heated temperature controlled room it was thought that opening the door to the room would disturb the room’s temperature. To simulate this a digital input on the process’ PLC was set introduce a negative step of -1.5 gain to a disturbance transfer function, and stepped back to 0 when the digital input receives a false signal.
Process Summing Point
As the Process PLC is simulating the process, plus disturbance, plus noise, a summing point was added before sending the summed value to the Process PLC’s analog output to give a more realistic result.
Pseudo Random Number / Noise Generator
| Implementing a pseudo random number generator with the desired level of apparent randomness took a some consideration of entropy and a few approaches were looked at before a best candidate was found.In the method used, a total of 4 bytes were mixed in various ways. Firstly the system clock memory Byte was read, duplicated to fill the first two bytes of the mix then XORed with the latter two bytes before being duplicated to fill all four bytes. The first two bytes were then bitwise rotated before having a value read. This appeared to produce the desired result.For a more realistic simulation, this noise (-1 to 1) was multiplied by an analog input of 0 to 1 and passed through a first order transfer function with a tau of 20ms and gain of one. |   |
Low Pass Noise Filter
To construct the filter there were a few real world considerations to weigh up.
The main considerations were that the output port of the filter would likely not have infinite impedance, the maximum output current of the analog output could be quite small and that the frequency of the noise could be quite close to that expected by the process.
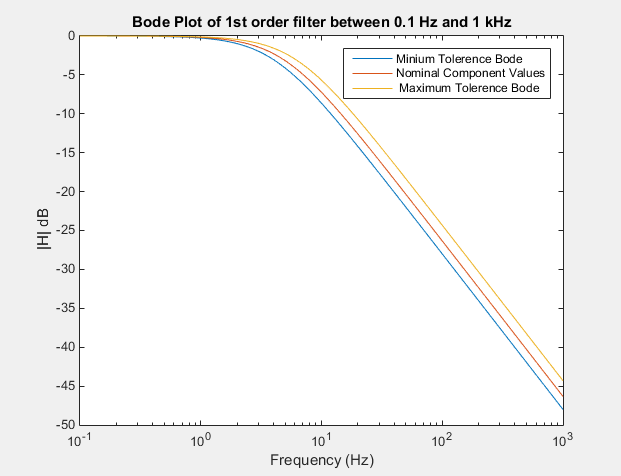
After considering this the chosen components were a +/- 1% 1k Ohm resistor and a +/- 20% 33 uF capacitor giving an idealised cut-off frequency of 4.823 Hz.
Given there is a significant tolerance margin with the components chosen and that first order filters are far from ideal, a Bode plot was constructed to model filter’s performance.
These values appeared appropriate to get the desired performance and would limit the current drawn from the analog output to a maximum of 10mA which is within the instrument control range.