This section gives an overview of the entire project with all its features.
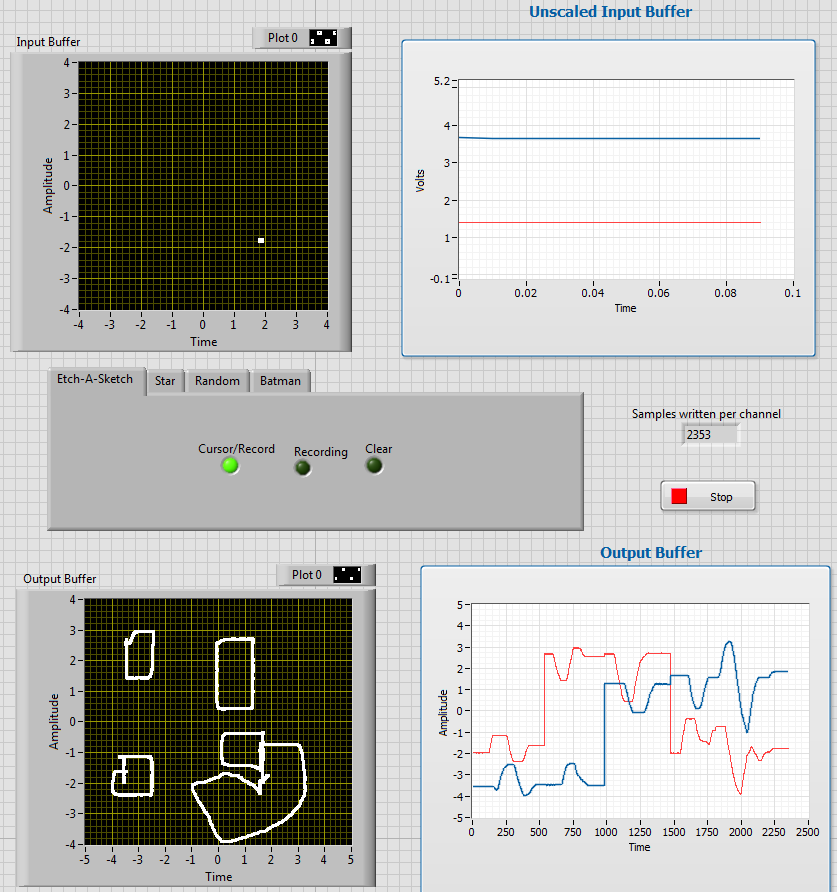
LabView Output and mode selection
The sketch is not only displayed on the oscilloscope but is also shown on an X-Y chart labeled “Output Buffer” on the LabView front panel. This has first been done for debugging purposes but has proved to be very useful in case no oscilloscope was available during development of the program.
The X-Y char labelled “Input Buffer” always shows the current location of the cursor. The current cursor location can be altered via the two potentiometers on the custom board that is attached to the USB-DAQ.
The tab in the middle is for mode selection. The program supports four different operation modes:
Etch-A-Sketch
In this mode, the user can move the cursor around with the two potentiometers on the custom board. When Record mode is selected, the location will be logged and the drawing is displayed on both the Output Buffer chart and the oscilloscope.
The state of the Etch-A-Sketch mode is controlled by three buttons and one switch on the custom board.
Star
When the user enters the Star mode, a star is displayed on both the oscilloscope and the Output Buffer chart. Cursor control via the potentiometers are disabled in this mode.
Random
The display of the oscilloscope and the Output Buffer chart are filled with random cursor locations whereas each random location is represented by a dot.
Batman
Upon entering Batman mode on the LabView tab, the batman theme is played and the batman sign is displayed on both the oscilloscope and the Output Buffer chart.
Custom board
The visual indicators and controls have been put on a custom board. The switch on the board controls Cursor/Record and the buttons control start, pause and clear when in sketching mode.
The LEDs show the current state of the program and are the same ones as the boolean indicators on the LabView front panel.
The two potentiometers control the X and Y position of the cursor in Etch-A-Sketch mode: the potentiometer on the right is for Y positioning and the potentiometer on the left is for X positioning.
The final custom board looks as shown in the picture below.

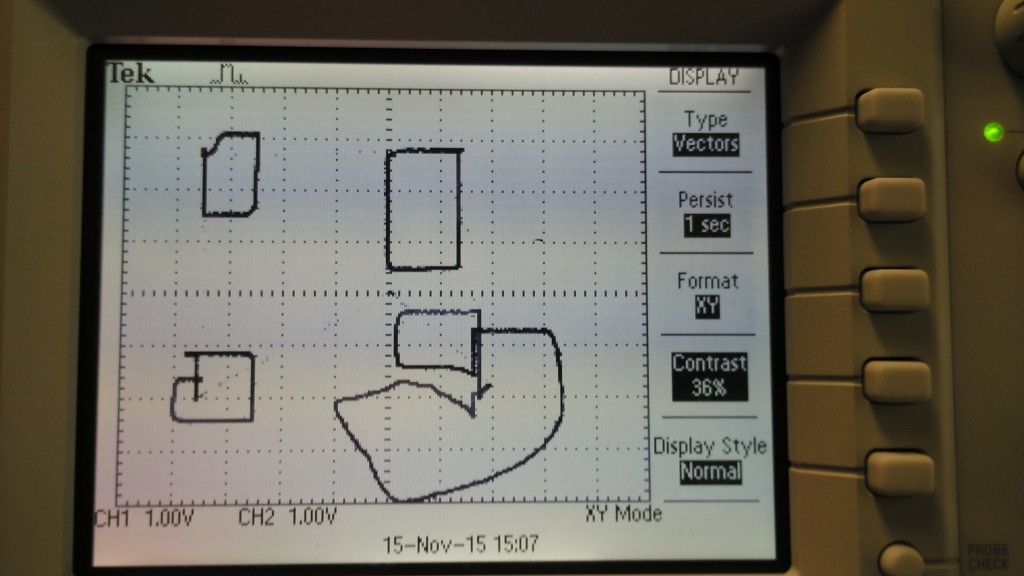
Oscilloscope output
When the analog outputs of the NI-6221 DAQ are connected to an oscilloscope, the drawing can also be displayed on the oscilloscope screen. The NI-6221 DAQ was used as it is faster than the USB-DAQ and can display more samples in a shorter amount of time. That means that the persist of 1sec would be enough.
Predefined sketches
There are two predefined sketches that can be output on the screen: the Batman and the Star.
An equation was used for both of the predefined sketches to output the voltage for X and Y position of the cursor.
For the Batman, the X and Y values can be seen in the screenshot of the LabView program seen below. The two graphs on the bottom are the values for X and Y, the chart on the left represents the X voltage and the chart on the right represents the Y voltage.

The output on the oscilloscope looks as follows

Upon entering the Batman mode, the batman theme is playing.
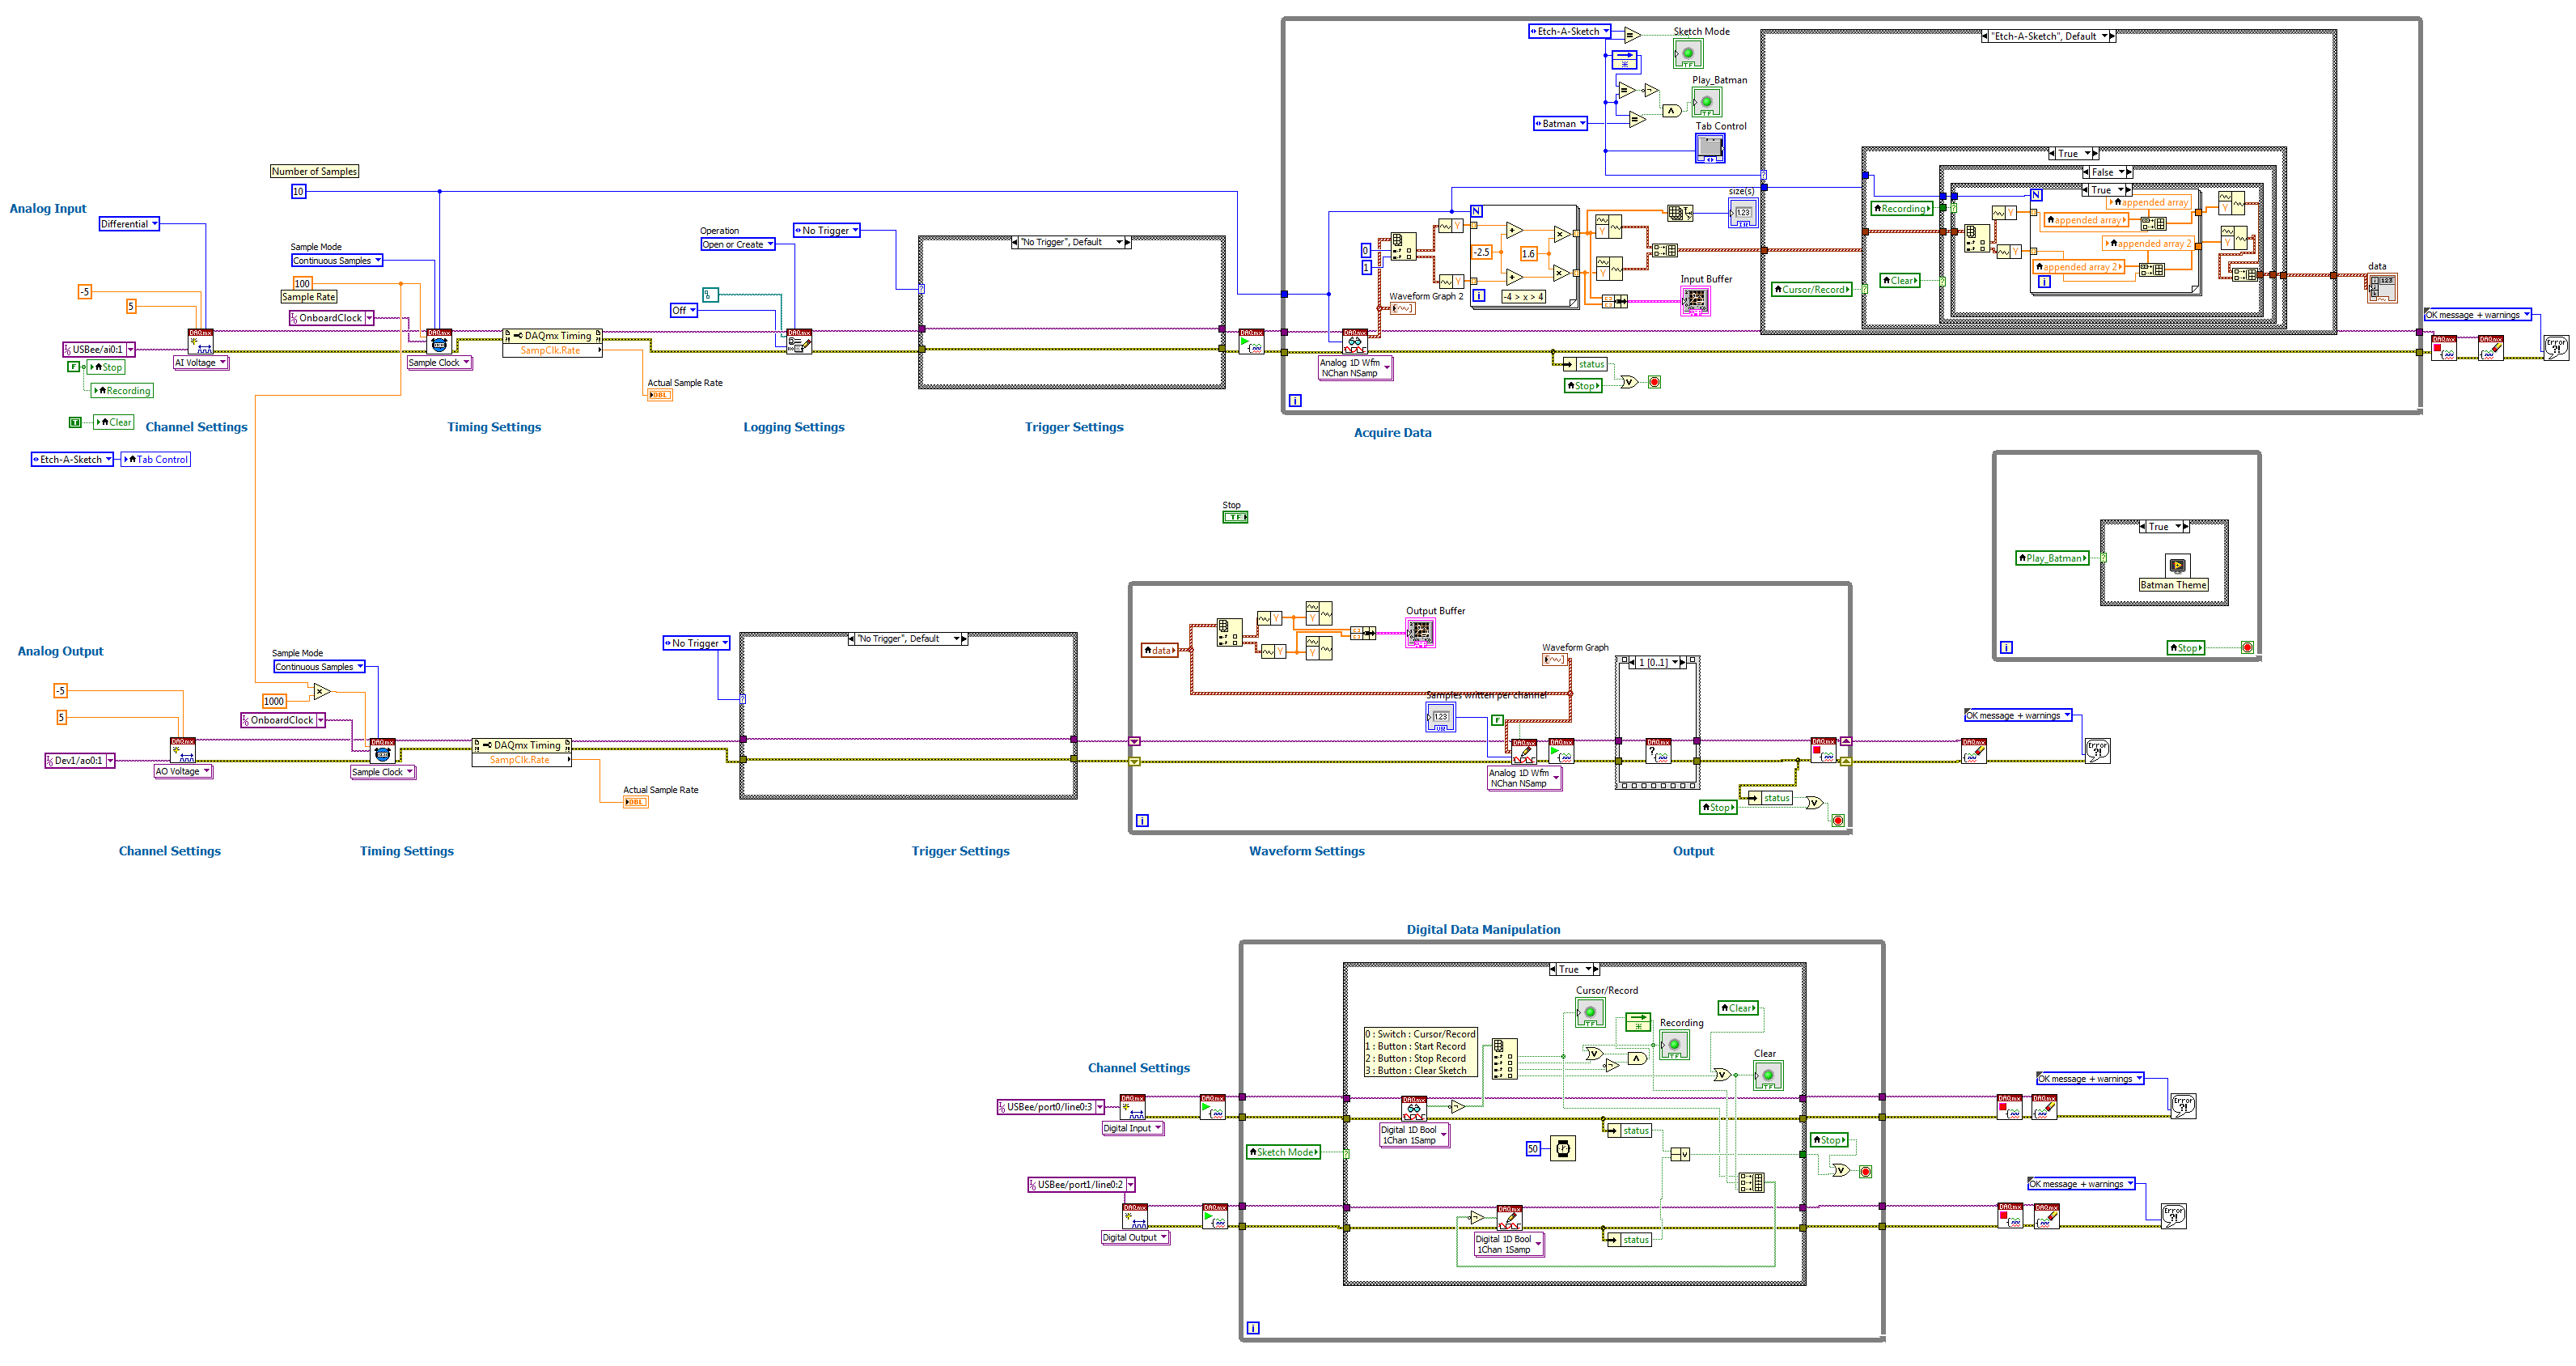
LabView program
The final LabView program looks as follows: