In Etch-A-Sketch mode, the data being sketched can either be recorded to draw lines and figures or the current location of the cursor is just displayed as a dot.
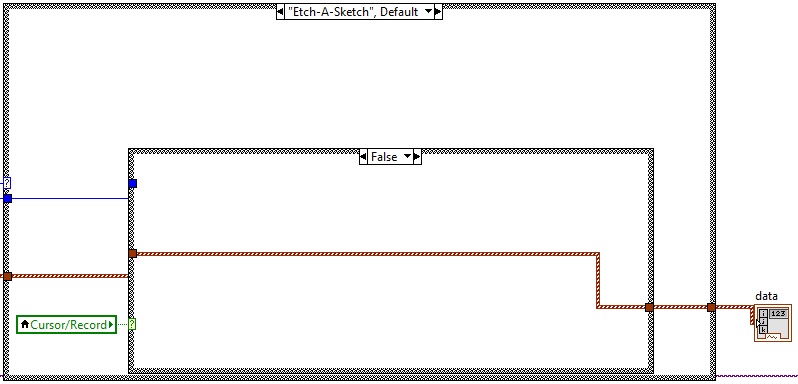
When the program is in Cursor mode, then the cursor location is put straight out whereas the cursor location can be changed via the X and Y potentiometers. The Cursor mode is implemented in LabView as shown below:

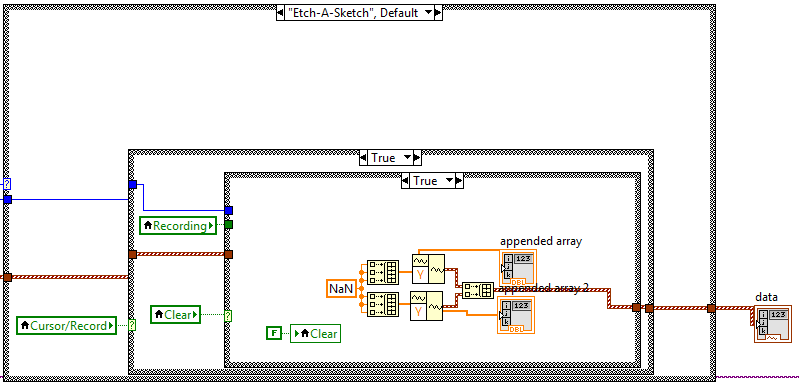
When the user has selected recording mode then an empty array is first being displayed. While the user is sketching on the oscilloscope, the clear button can always be pressed which results in erasing the entire drawing on the oscilloscope so the user can start over. This is done by filling the array displayed with not a number. The LabView implementation of this feature looks as follows:

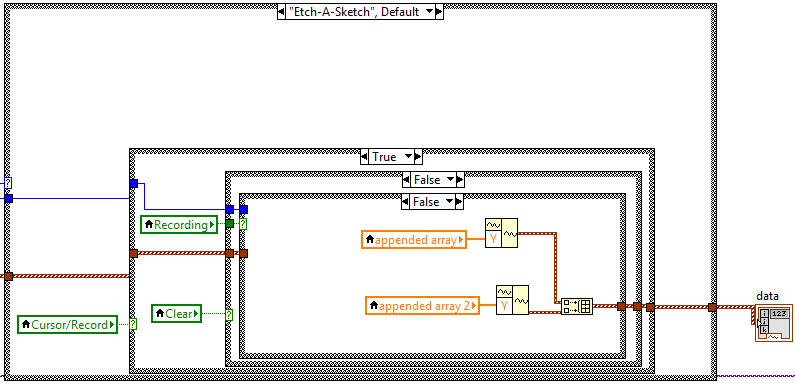
Record mode can always be paused and resumed. When it is paused, the currently recorded data is continuously displayed and the user can move the cursor to a different point on the oscilloscope before resuming the recorded sketch. When the recording is paused, the LabView program executes the following part:

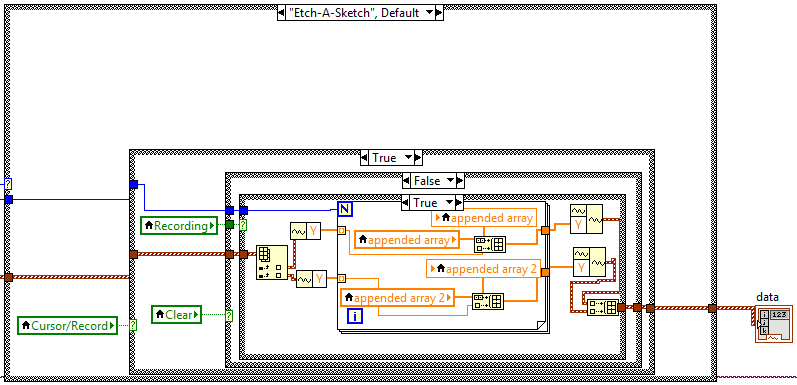
When the recording has started, the values are always appended to the array. This is being done by feeding a variable with last array in and appending the next X-Y value. There are two different arrays for X and Y values which are then converted to a waveform, bundeld and displayed on a X-Y chart and on the oscilloscope. The appending can be seen below.

