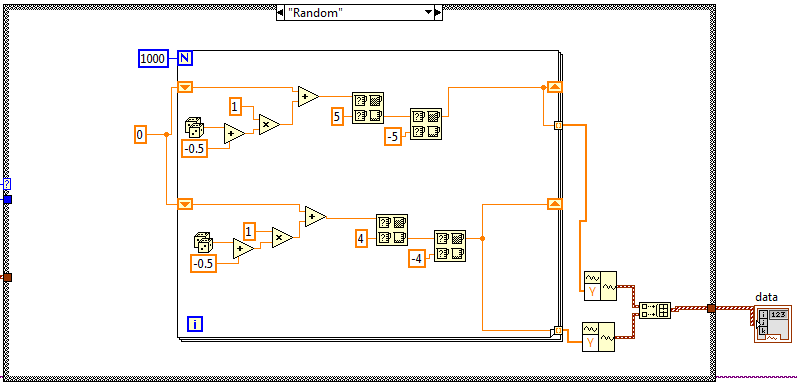
When the program is in random mode, a random number is always being added to the X and the Y position of the last cursor location. The output of the oscilloscope looks similar the the chart on the left. The X and Y values are displayed in the chart on the right. The chart on the right shows that the output does not follow a uniform random distribution even though an uniform random number is added to the last X and Y location.

The outputs are limited to the size of the oscilloscope screen and the analog output range selected. The implementation of the Random mode in LabView looks as follows:

